●Metrics & Data
Your metrics, where the journey happens
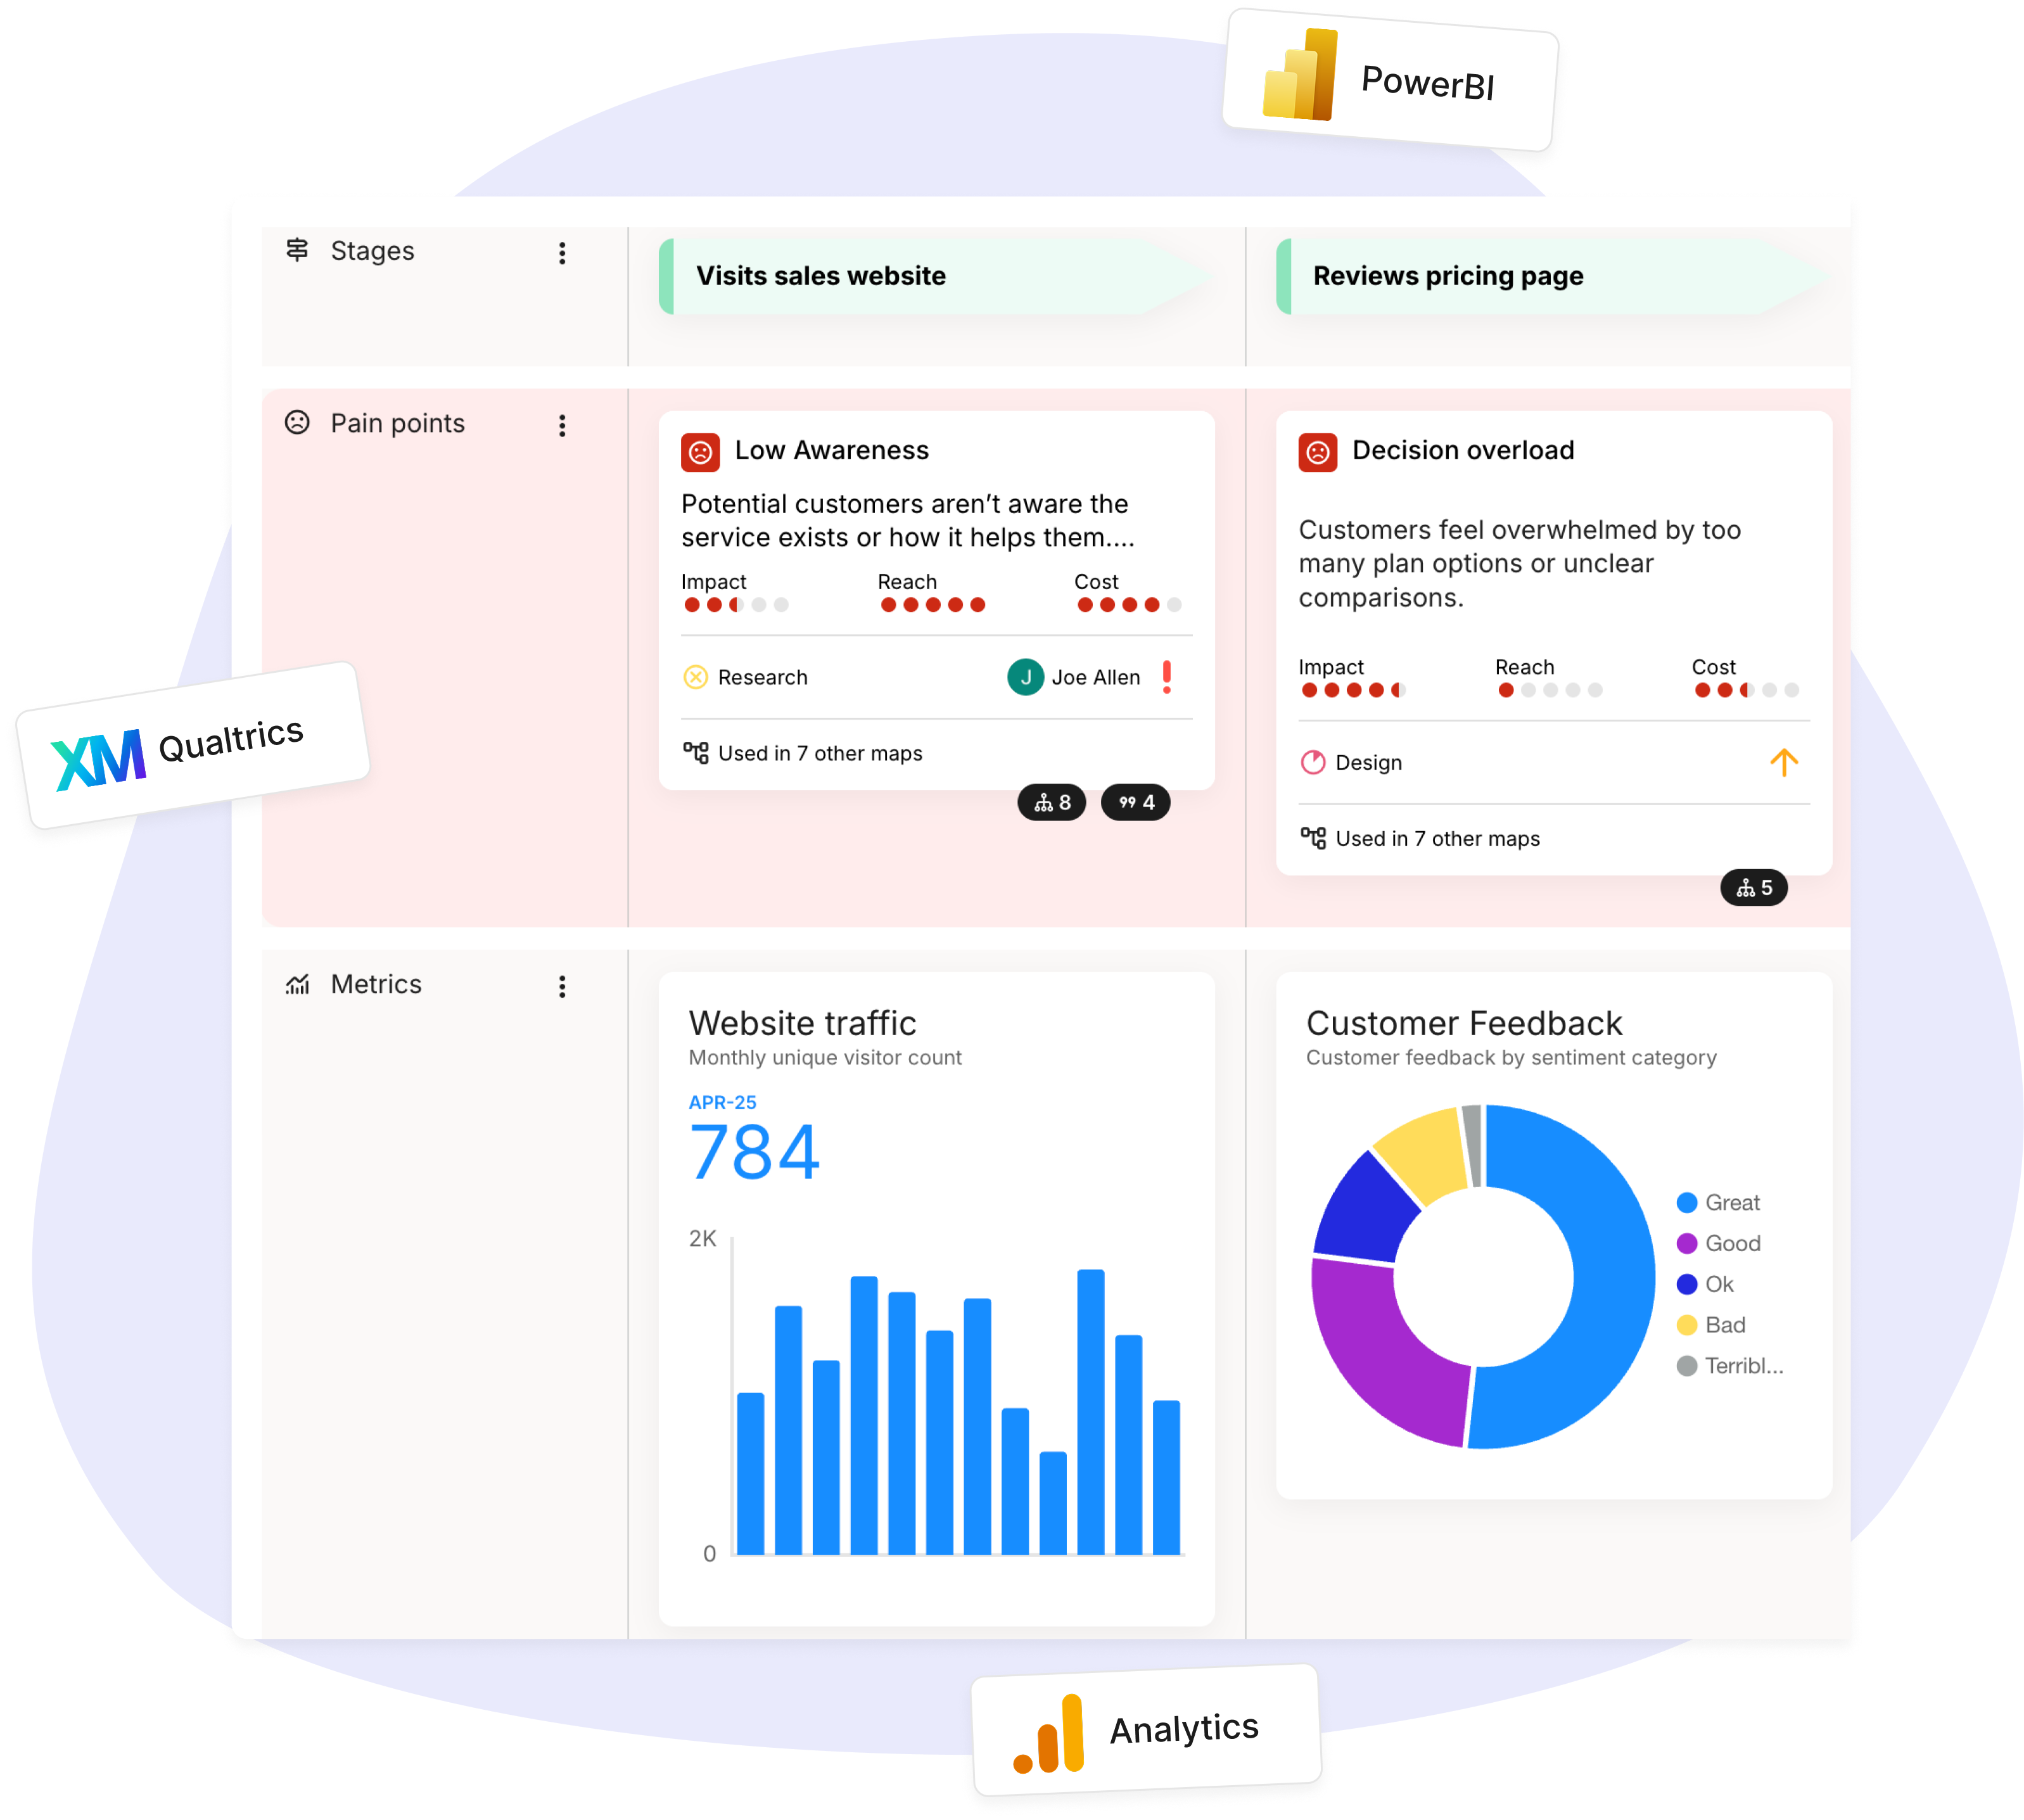
Put live data on the steps it belongs to, next to the customer feedback that explains it.
●Integrations
Bring in the data you already track
Connect the tools your numbers already live in, or pipe anything in through a spreadsheet.
Browse all 20+ integrations →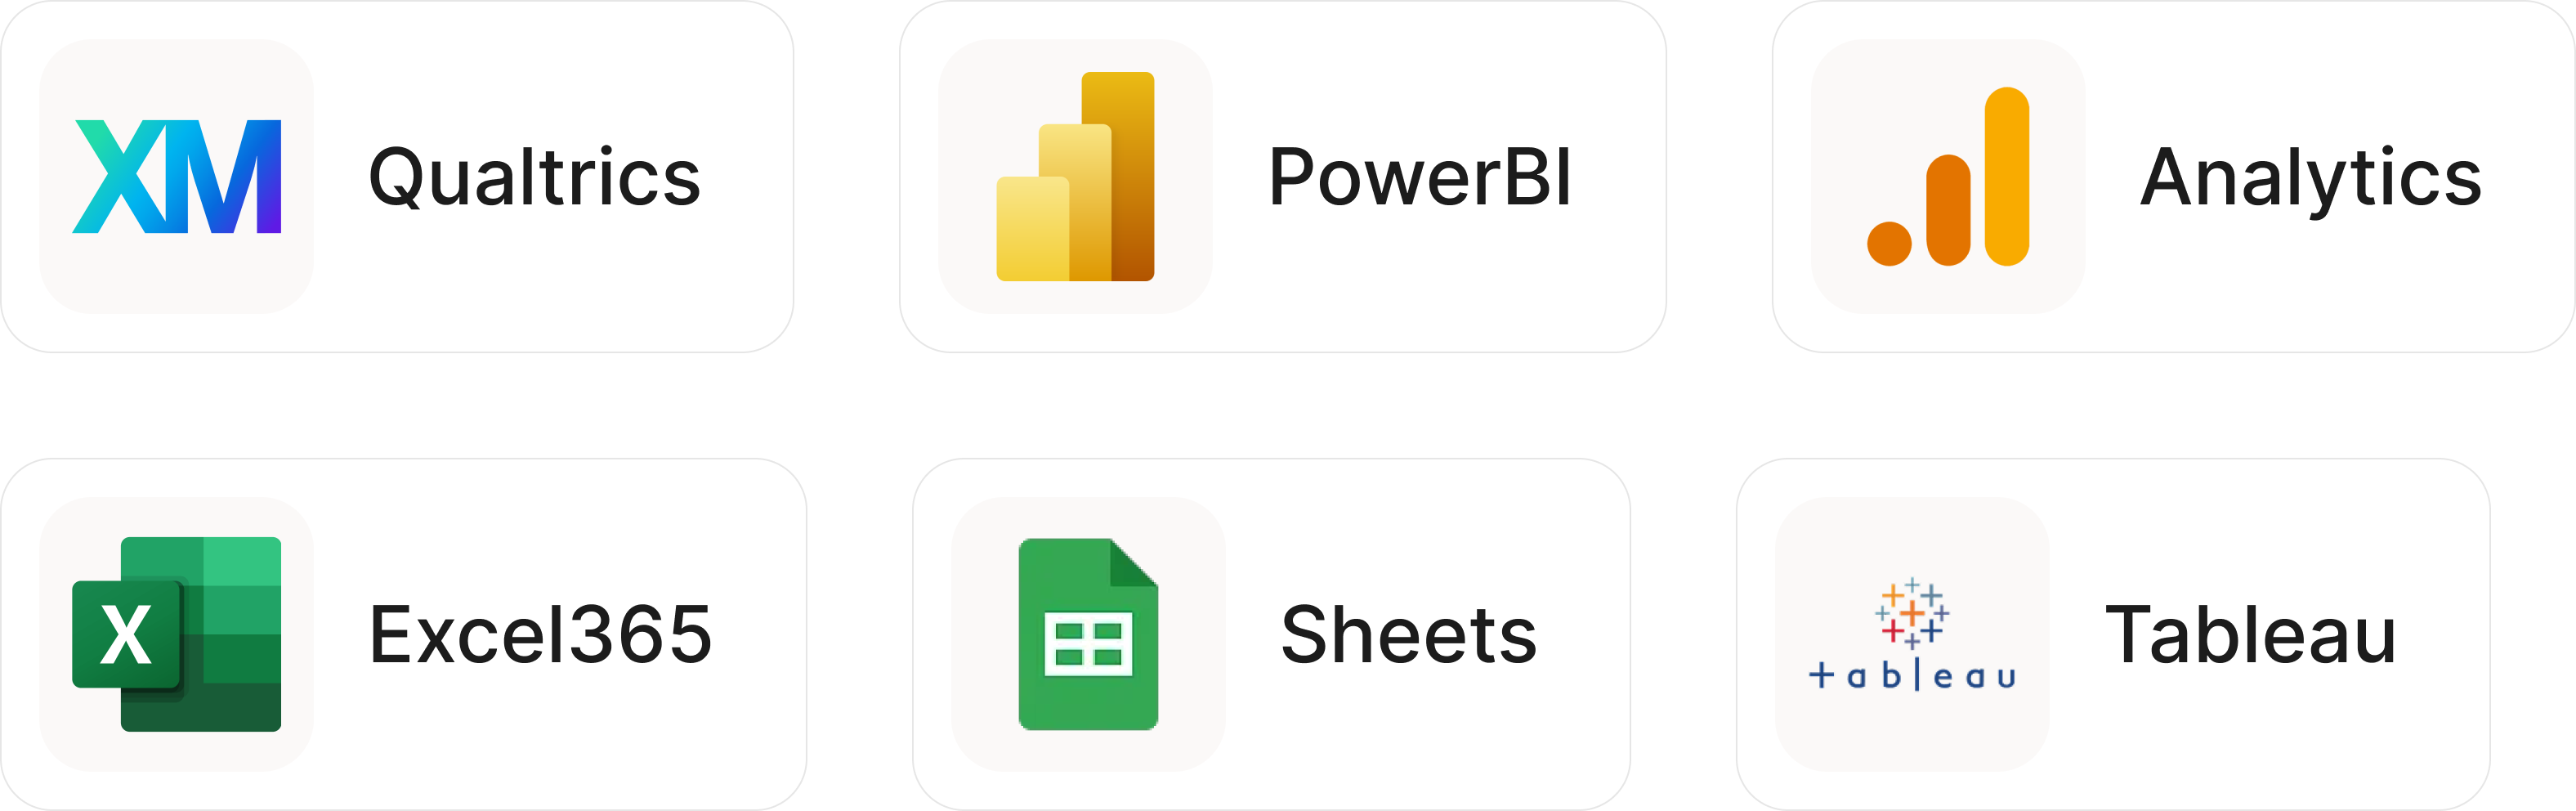
●In context
See the number on the step it belongs to
Not a dashboard in another tab. The metric, in the journey.
- ✓Place any metric on the journey step it measures
- ✓Read a dip where it happened, not in a separate report
- ✓Keep data and experience in one view

●Qual and quant
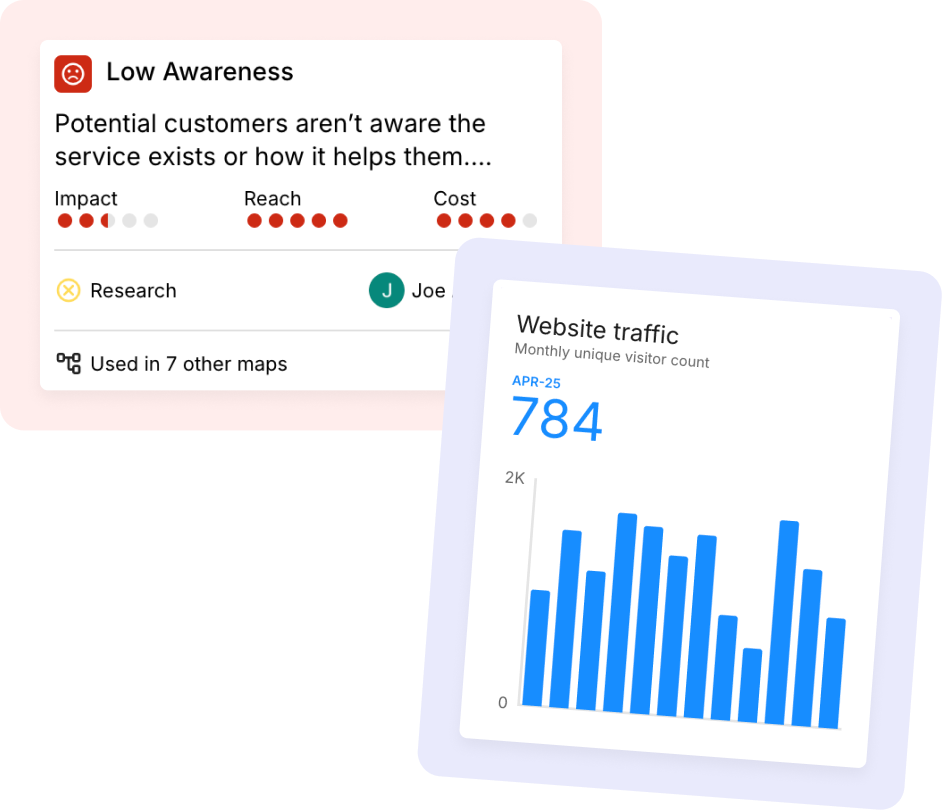
The score and the story, side by side
Numbers tell you what moved. The feedback beside them tells you why.
- ✓Sit a survey score next to the customer quote behind it
- ✓Show a drop-off right beside the pain point that caused it
- ✓Give every number the context that makes it mean something
●Visualize
Show each number the way it reads best
A single figure, a trend, or a comparison, in the chart that fits.
- ✓Track a single value, a series over time, or two values compared
- ✓Choose the chart that fits: bar, line, pie, donut, gauge, or table
- ✓Tune each card: headline value, labels, decimals, axis bounds

●Beyond dashboards
A dashboard tells you what changed. The journey tells you why.
The same numbers, read where the experience actually happens.
IN A DASHBOARD
Numbers without context
✓A number with no journey around it
✓Quant in one tool, customer feedback in another
✓Export a chart, rebuild the story in a deck
✓The why is yours to reconstruct
+
IN THE JOURNEY
Numbers with meaning
✓The number sits on the step it measures
✓Quant and qual read side by side
✓Journey health visible at a glance
✓The why is already next to it
●The platform
Map, prioritize, and measure in one place
Measurement is one part of how Smaply turns customer understanding into action.
●Journey Maps
Metrics in journey context
Put metrics on the journeys and steps they measure.
Learn more →●Portfolio and Prioritization
Act on what the data shows
Turn what the numbers reveal into ranked priorities.
Learn more →●Integrations
Connect your data sources
Google Analytics, Power BI, Excel, Sheets, and Qualtrics.
Learn more →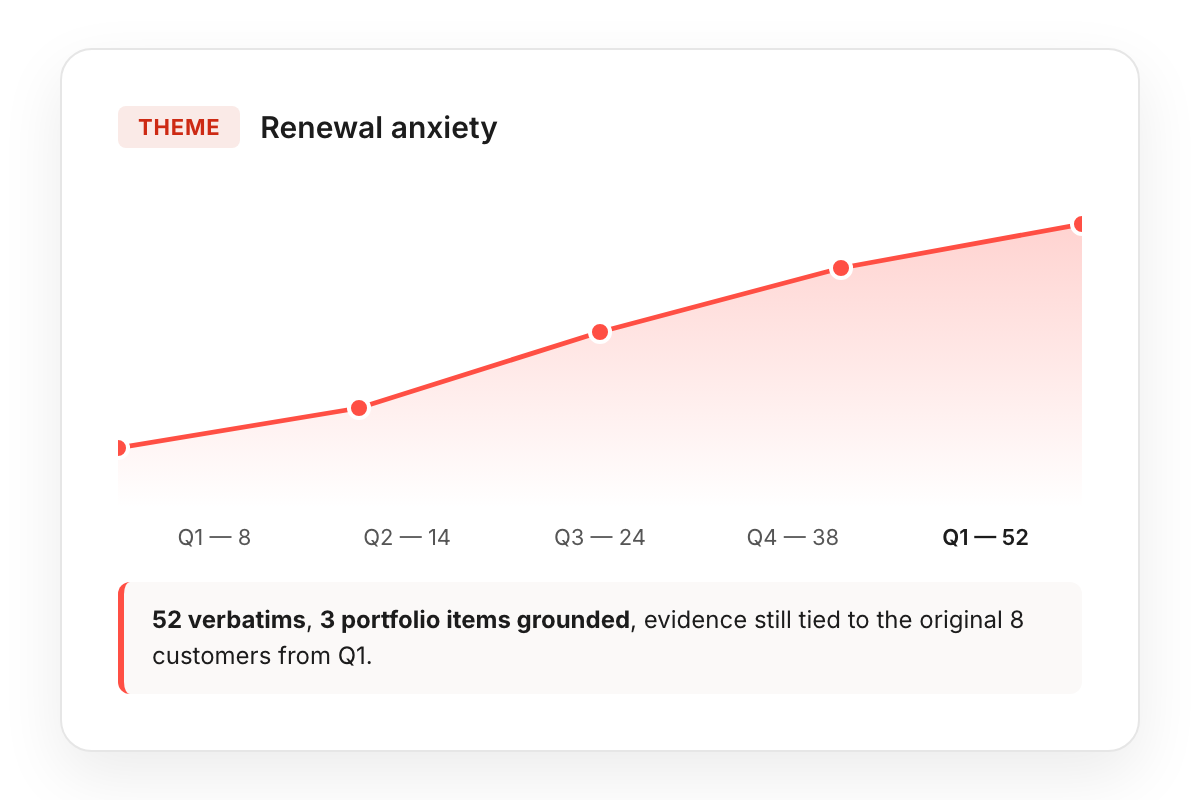
●Get started
Stop reading your numbers out of context
Bring your data into the journeys it measures, next to the feedback that explains it.
●Connects with
Where your data comes from, and what it informs
Metrics flow in from the tools you already use, land on the journeys they measure, and keep journey health honest over time.


