Most organizations track customer metrics. Few track them in the context of the customer journey. The difference matters more than most teams realize.
Journey metrics measure customer experience across an end-to-end customer journey, not just at individual touchpoints. They show whether a journey is working, where it breaks down, and where improvement creates the most impact. The problem with most metrics guidance is that it lists 20 or more KPIs without explaining which ones matter for your context or what to do when a score changes. Tracking metrics without acting on them is expensive overhead that looks productive but changes nothing.
Metrics are what make customer journey management measurable. Without them, the practice produces insights but can't prove impact or justify investment. This post covers which journey metrics to track, how to connect them to your journey maps, and what action to take when they move.
Journey metrics vs. touchpoint metrics
This distinction gets overlooked constantly, and it changes how you measure.
Touchpoint metrics measure individual interactions. How satisfied was the customer with this support call? How easy was this checkout? They tell you about a moment.
Journey metrics measure the end-to-end experience against the customer's goal. How effectively did the customer accomplish what they set out to do across all the touchpoints involved? They tell you about the experience.
| Touchpoint metrics | Journey metrics | |
|---|---|---|
| Scope | Single interaction | End-to-end experience |
| Question answered | "How was this moment?" | "Did the journey work?" |
| Example | CSAT after a support call | Journey completion rate for support resolution |
| Reveals | Interaction quality | Systemic issues across touchpoints |
Why this matters: a customer can rate every individual touchpoint 4 out of 5 and still feel the overall journey was frustrating. Too many steps, too much time, inconsistent information across channels. Touchpoint scores can all be strong while journey completion rates are weak.
Fixing a touchpoint in isolation may not improve the journey if the real problem is the connection between touchpoints. Journey-level measurement reveals the systemic issues that touchpoint measurement misses.
The core journey metrics
Not a list of 21 KPIs. A focused set organized into three categories that cover what you actually need to manage journeys.
Perception metrics: how customers feel
These capture the customer's subjective experience at key moments and across the journey.
NPS (Net Promoter Score) measures the likelihood a customer would recommend your product or service. It works best as a journey-level metric collected after the full experience, not at individual touchpoints. NPS reveals overall relationship health and loyalty trajectory.
CSAT (Customer Satisfaction Score) measures satisfaction with a specific experience. Place it at key moments of truth within the journey: after onboarding, after first purchase, after a support interaction. More granular than NPS, it tells you how specific stages perform.
CES (Customer Effort Score) measures how easy or difficult an experience was. Especially valuable for service, support, and onboarding journeys where effort directly predicts loyalty. High effort at any stage is a leading indicator of churn, even if satisfaction scores look acceptable.
When to use which: NPS for overall journey health, CSAT for specific stage performance, CES for friction-heavy journeys where ease matters most.
Outcome metrics: what actually happened
These track whether the journey delivered its intended result.
Conversion rate is the percentage of customers who completed the journey's intended outcome: a purchase, a signup, a resolution. The baseline metric for any journey with a defined goal.
Journey completion rate tracks how many customers who start the journey actually finish it. More importantly, it shows where they drop off. A 40% completion rate with most exits at Stage 3 tells you exactly where to focus.
Time to completion measures how long the journey takes from start to finish. Is it getting faster or slower? Time trends often signal underlying friction before satisfaction scores move.
First contact resolution (FCR) applies to service and support journeys. Was the issue resolved in one interaction, or did the customer have to come back? FCR is both an outcome metric and a strong predictor of satisfaction.
Business impact metrics: what it means for the organization
These connect journey performance to the numbers leadership cares about.
Customer Lifetime Value (CLV) is the total revenue a customer generates over their relationship. Journey improvements should ultimately move this number. If they don't, you're optimizing the wrong things.
Churn rate is the percentage of customers who leave within a given period. Critical for retention and renewal journeys. A journey-level churn analysis shows which journeys have the highest loss rates and where intervention has the most impact.
Cost to serve tracks what it costs to deliver the journey. Efficiency improvements, like reducing support contacts by fixing a confusing onboarding step, show up here.
These metrics are how you connect journey work to business outcomes and justify continued investment.
Leading vs. lagging indicators
This distinction is missing from most journey metrics guidance, and it changes how you use your measurement system.
Lagging indicators tell you what already happened. NPS dropped. Churn increased. Conversion fell. They confirm a problem, but by the time they move, the damage is done.
Leading indicators signal what's coming. CES is rising, which means effort is increasing and churn will likely follow. Journey completion time is growing, which means conversion will probably drop. Support ticket volume at a specific stage is spiking, which means satisfaction is about to fall.
Pair every lagging indicator with at least one leading indicator.
| Lagging indicator | Paired leading indicator | Why it matters |
|---|---|---|
| NPS decline | CES increase at key stages | Effort predicts loyalty erosion before NPS moves |
| Churn spike | Drop in engagement frequency | Disengagement precedes cancellation |
| Conversion drop | Stage abandonment rate increase | Drop-offs signal where the journey breaks |
| CLV decline | Decrease in repeat purchase rate | Purchase frequency predicts lifetime value |
Leading indicators give you time to act. Lagging indicators confirm whether your actions worked. A measurement system that only includes lagging indicators is a system that only reacts. One that includes leading indicators can prevent.
Connecting metrics to your journey maps
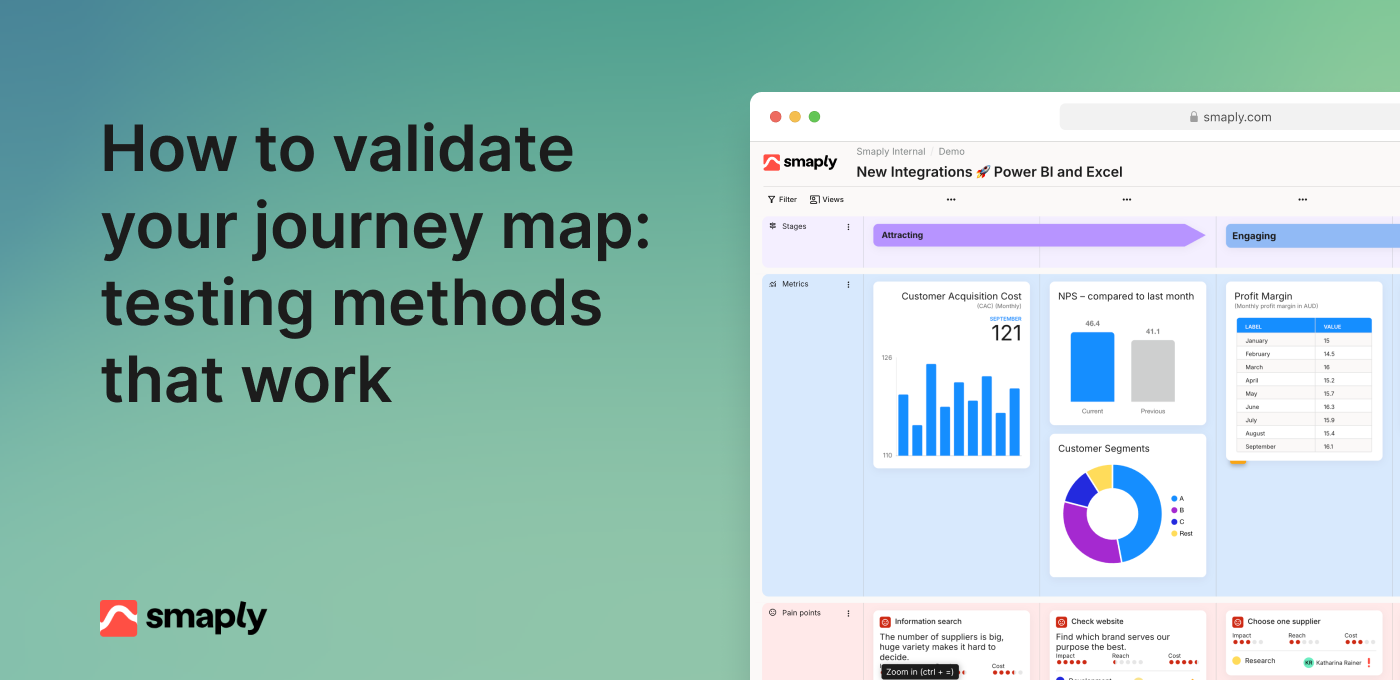
Metrics in a dashboard show numbers. Metrics on a journey map show context. The difference is diagnostic power.
How to attach metrics to maps:
- Perception metrics (CSAT, CES) go at the journey stages where they're collected. If you survey customers after onboarding, the score attaches to the onboarding stage
- Outcome metrics (conversion, completion) go at transition points between stages. Conversion happens between consideration and purchase. Drop-off rates appear at each stage boundary
- Business impact metrics (CLV, churn) attach at the journey level, not individual stages. They're the headline numbers for the journey as a whole
What this enables: you can see which stages have the weakest scores and correlate them with drop-off data. You can identify whether a satisfaction dip at Stage 3 is causing churn at Stage 5. You can track how an improvement at one stage affects metrics downstream.
Where possible, connect live data feeds so the map reflects current performance rather than a historical snapshot. When a metric moves, the map shows it. Static numbers get stale. Live data keeps the map relevant and triggers reviews when performance shifts.
Smaply pins every score to the journey stage it measures, so a dip shows you exactly where to look.
How to choose the right metrics for your journey
Not every journey needs every metric. Over-measuring creates noise that obscures signal.
| Journey type | Priority metrics | Why |
|---|---|---|
| Acquisition / conversion | Conversion rate, stage drop-off, cost per conversion | Focus on completion and efficiency |
| Onboarding | Time to value, completion rate, CES | Focus on activation and effort reduction |
| Service / support | FCR, CES, CSAT | Focus on resolution and ease |
| Retention / renewal | Churn rate, CLV, NPS | Focus on loyalty and lifetime value |
| Advocacy | NPS, referral rate | Focus on promotion behavior |
Start with three metrics per journey: one perception metric, one outcome metric, one business impact metric. This gives you enough to assess whether the journey is working and where it isn't, without overwhelming your team with data.
Expand only when you need more diagnostic depth. If your three metrics show the onboarding journey is underperforming but you can't tell why, add stage-level CES or completion rates to pinpoint the problem. The right number of metrics for each stage is the smallest set that tells you what you need to know to make decisions.
Acting on journey metrics
This is where most metrics content stops and where the real value starts. A metric that doesn't trigger action is a number on a screen.
Detect: when does a change warrant attention?
Not every fluctuation is a signal. Set thresholds that distinguish noise from patterns.
- Absolute thresholds: A 5-point NPS move in a single month is likely noise. A 15-point drop is a signal. Define what "significant" means for each metric based on your historical variance
- Trend thresholds: A single bad month is context. Three consecutive declining months is a pattern. Monitor trends, not snapshots
- Comparative thresholds: Compare against your own baselines, not industry averages. Your onboarding CSAT dropping from 4.3 to 3.8 matters more than whether the industry average is 4.1
Diagnose: where is the problem?
Once a threshold is breached, drill into the journey map.
- Which stage shows the largest metric decline? The map's stage-level data points the investigation
- Cross-reference perception and outcome metrics. Did satisfaction drop, or did behavior change? Both? One without the other suggests different root causes
- Check leading indicators. Did effort or drop-off rates signal this before the lagging metric moved? If so, your detection could be earlier next time
- Talk to customers. Quantitative data shows where the problem is. Qualitative research reveals why. Run 3 to 5 quick interviews focused on the flagged stage
Respond: what do you do about it?
- Prioritize based on impact. Which metric movement affects the most customers or the most revenue? Fix the highest-leverage problem first
- Connect to the roadmap. Metric-driven insights feed directly into your prioritization framework. "CES increased 20% at the billing stage, correlating with a 12% churn increase" is a business case, not just a data point
- Track the intervention. After making a change, monitor leading indicators first. Did effort decrease? Did drop-off rates improve? Lagging indicators like NPS and churn will follow weeks or months later. Don't wait for them to declare success or failure
Common journey metrics mistakes
Measuring everything, acting on nothing. Dashboards full of metrics with no process for reviewing them or triggering action. Fewer metrics with a clear action framework beats comprehensive measurement with no response process.
Touchpoint scores without journey context. Optimizing individual interactions without understanding how they affect the end-to-end experience. A fast checkout means nothing if the return process erodes all the goodwill.
Lagging indicators only. Tracking NPS quarterly and reacting after the damage is done. Add leading indicators to catch problems while you still have time to respond.
Metrics disconnected from maps. Numbers in a spreadsheet, not attached to the journey stages they represent. Without spatial context, diagnosis is guesswork.
No baseline or trend tracking. A CSAT score of 4.2 means nothing without knowing it was 4.5 last quarter. Trends reveal trajectory. Snapshots reveal nothing.
Vanity metrics. Tracking numbers that look good in a report but don't connect to customer or business outcomes. Page views without conversion context. Satisfaction scores without retention correlation. If a metric doesn't inform a decision, stop tracking it.
Journey metrics measure what matters: whether the end-to-end experience works for customers and for the business. Track perception, outcome, and business impact metrics. Pair lagging indicators with leading ones. Connect metrics to your journey maps so numbers have context.
Measurement without action is overhead. Use the Detect, Diagnose, Respond framework to turn metric changes into decisions. Start with three metrics per journey. Expand when you need more diagnostic depth, not before.
One home for maps, metrics, and the reviews that turn a moving number into a clear next step.
FAQ
What are journey metrics?
Journey metrics measure customer experience across an end-to-end journey, not just at individual touchpoints. They include perception metrics (NPS, CSAT, CES), outcome metrics (conversion rate, completion rate), and business impact metrics (CLV, churn rate). Together, they show whether a journey is working and where it breaks down.
What's the difference between journey metrics and customer experience metrics?
Customer experience metrics is the broader category. Journey metrics are CX metrics applied in the context of a specific customer journey, attached to stages and transitions rather than measured in isolation. The same metric (like CSAT) becomes a journey metric when it's placed at a specific journey stage and used to diagnose journey-level performance.
How many metrics should I track per customer journey?
Start with three: one perception metric, one outcome metric, one business impact metric. This provides enough signal to assess performance and identify problems. Add more only when you need diagnostic depth at specific stages.
How often should journey metrics be reviewed?
Monthly for high-priority journeys, quarterly for stable ones. Leading indicators should be monitored continuously or weekly where automation supports it. Align metric reviews with your journey governance cadence so measurement and maintenance happen together.
How do I connect journey metrics to my journey maps?
Place perception metrics at the stages where they're collected, outcome metrics at transition points between stages, and business impact metrics at the journey level. Use live data feeds where possible so the map reflects current performance rather than historical snapshots.