
What is a map and what is it good for?
Knowledge is a key success factor in today’s society and economy. Knowledge exchange therefore is a crucial enabler facing increasing socio-economic and socio-cultural challenges. Different stakeholders interpret a certain context in different ways. Making good decisions therefore requires tools and methods that allow us to deliver information that is comprehensive, transparent, and understandable at the same time.
To allow a participative way of delivering information and to allow the creation of useful communication structures, data has to be delivered in approachable and applicable ways. Reflecting on different pieces of information and divergent point of views on the same matter, such tools need to allow us to incorporate all players on a multi-level approach.
One of humankind’s oldest ways to communicate, simplify information, and grant accessibility to such, are maps. Maps serve as boundary objects, which “[…] are objects that […] have different meanings in different social worlds but their structure is common enough to more than one world to make them recognizable, a means of translation. The creation and management of boundary objects is key in developing and maintaining coherence across intersecting social worlds” (Star & Griesemer, 1989).
As defined by Harley and Woodward, “maps are graphic representations that facilitate a spatial understanding of things, concepts, conditions, processes or events in the human world” (Harley & Woodward, ed, 1987).
As maps serve as a matter of communication about space, humans have been trying to make sense of their spatial surroundings even before the physical artifact of a map evolved.
Maps are tools of communication which help to make sense of the human environment at different scales.
They serve as a translator between the human’s inner mental world and the outer physical world, and thus are guidelines and a tool that helps us to make sense of a complex world. They allow us to exchange knowledge, and deliver information that is comprehensive, transparent, and understandable. They allow us to display information in an approachable way, and allow us to reflect on information using different lenses and divergent points of view.
Scale, focus, projections, contextualisation
Maps are often heavily influenced by their creators, and often represent the status quo of knowledge of the era they’ve been created in.
In times when people couldn’t simply learn from the internet or build on satellite data, they had to use what they knew. In the past, most map creators didn’t state the fact that some of the maps’ content wasn’t data-backed, or that they filled these gaps with assumptions and visualisations of what they thought something might look like.

Until Captain James Cook managed to circumnavigate Antarctica, people believed that there had to be a huge land mass in the South, which they called Terra Australis Incognita. It was supposed to be the balance weight for the land masses in the Northern hemisphere, and not many people questioned this theory until it was proved wrong in 1772. What sticks until today is the name of an entire continent – Australia.

The very same thing happens with customer journey maps. Maps are created that build a foundation of knowledge and action, but they aren’t always research based. The assumptions they are based on aren’t questioned. Yet still, decisions are made based on these knowledge gaps, and organizations invest budget based on these assumptions. Just like it required daring adventurers to go beyond the known world, it requires dedicated teams to prove these assumptions wrong or right.
Organizations have to ensure that the status quo of knowledge / maps is constantly questioned so that maps evolve over time and are a close representation of reality.
Some assumptions may help you get started, but they should just provide that starting point and change if proven otherwise.
Humankind has always tried to move boundaries, go beyond them, and strived to know instead of only believe. Maps help us to locate the unknown, define the limits of the known, and help in planning where to start, where to go first, and to track where you’ve been coming from. This applies to geographical maps in the same way it does to journey maps.
Items every map should contain

A map that doesn’t contain metadata isn’t usable. You can hang it onto your apartment’s wall, but it won’t serve you for much more than that. Over the years we’ve learned what specific types of maps display and there are some aspects that become common sense over time. For example, we are used to reading topographic maps knowing that (most of the time) they display elevation using a specific colour range. Dark blue typically stands for deep sea, green for low elevation (a.s.l.), and red / brown for high elevation of land masses.
Some elements – such as a legend, scale type, grids, northing, title, and author – are essential to every good map. The following table compares some elements that help readers to better understand geographical maps and journey maps.

Visualising reality in 2D
Visualisations have two basic purposes: They help to simplify complex contexts and they are the basis for further insights once you analyse the information. They help to stay on top of things in the same way they display spatial, temporal, and causal coherence. Depending on a map’s focus, visualisations can serve to highlight specific relevant details whilst ignoring data that isn’t relevant to the cause. For a map to communicate relevant information, it has to be structured, precise, and efficient.
A maps purpose is driven by its way of use; they are highly interactive and serve to fill knowledge gaps for people who view them.
A geographical map represents an image of the earth’s surface following a specific focus and / or purpose (e.g. topographic, geological). One of the main challenges in creating maps is that the complexity of the earth’s surface can’t be exactly represented on a map. Maps therefore are an approximation of reality only. In geography, one mainly distinguishes between thematic and topographic maps. The former usually focuses on some selected pieces of information, like population density or GDP per capita, whereas the latter manage to display a 3D environment in 2D by adding isohypses (contour line), for example. These topographic maps usually require a reference point, like the sea level for altitude indication of specific areas on the map given.
Creators of journey maps should also always think about references needed. What status quo is your future state map referring to? What pieces of information are needed to point to the core problem depicted on your map? What kind of information would be misleading?
It’s important to be precise when it comes to referencing, as it helps set context for interpreting the data in your map.
As sea level isn’t the same in every part of the world (water mass isn’t equally spread over the planet due to various reasons), for example the height of mountains might differ, depending on the reference point chosen.
A world map helps to locate specific countries and gives a good overview of the bigger picture, but doesn’t help me find my way around a specific city. On the other hand , a city map doesn’t serve me when I try to find my way to another county. Thus, small-scale maps (zoomed out) help to understand the bigger picture, whereas large-scale maps (zoomed in) provide much more details that help me to navigate precisely when needed.
A journey map doesn’t only describe your services from your customer’s perspective, it also needs to simplify a highly complex situation and boil it down to a tangible level. To provide orientation / the right information, a map needs to break down this complex reality into understandable and easy to grasp pieces. Maps therefore always follow a purpose. It doesn’t matter if you plan your journey using analogue or digital maps, you’ll never fit all information on the very same zoom level. This applies to geographical orientation in the very same way as it does to journey maps.
The more familiar you are with a specific type of map, the more you tend to forget that others might not be. If you move to a new city, you’ll need a map that helps you orientate yourself, perhaps a city map or a map which shows your new city’s metro network. The data gets more and more familiar over time, and at a certain point, you’ll only need your map on specific occasions as you will learn to navigate through the city without it.
What becomes common sense for you, isn’t true for others. Maps need to be accessible to a (often) wide audience.
Imagine, friends of yours move to the same city a year after you do, and they ask you to help them get familiar with their new surroundings and tackle ongoing challenges. You’ll have to step into their shoes to remember the situation you were in before, so that you can describe things in a way that is understandable to your friends who are new to the city. A map will help you explain directions (boundary object!), will give them a more secure feeling when on their own, and will help them ask you more specific questions.
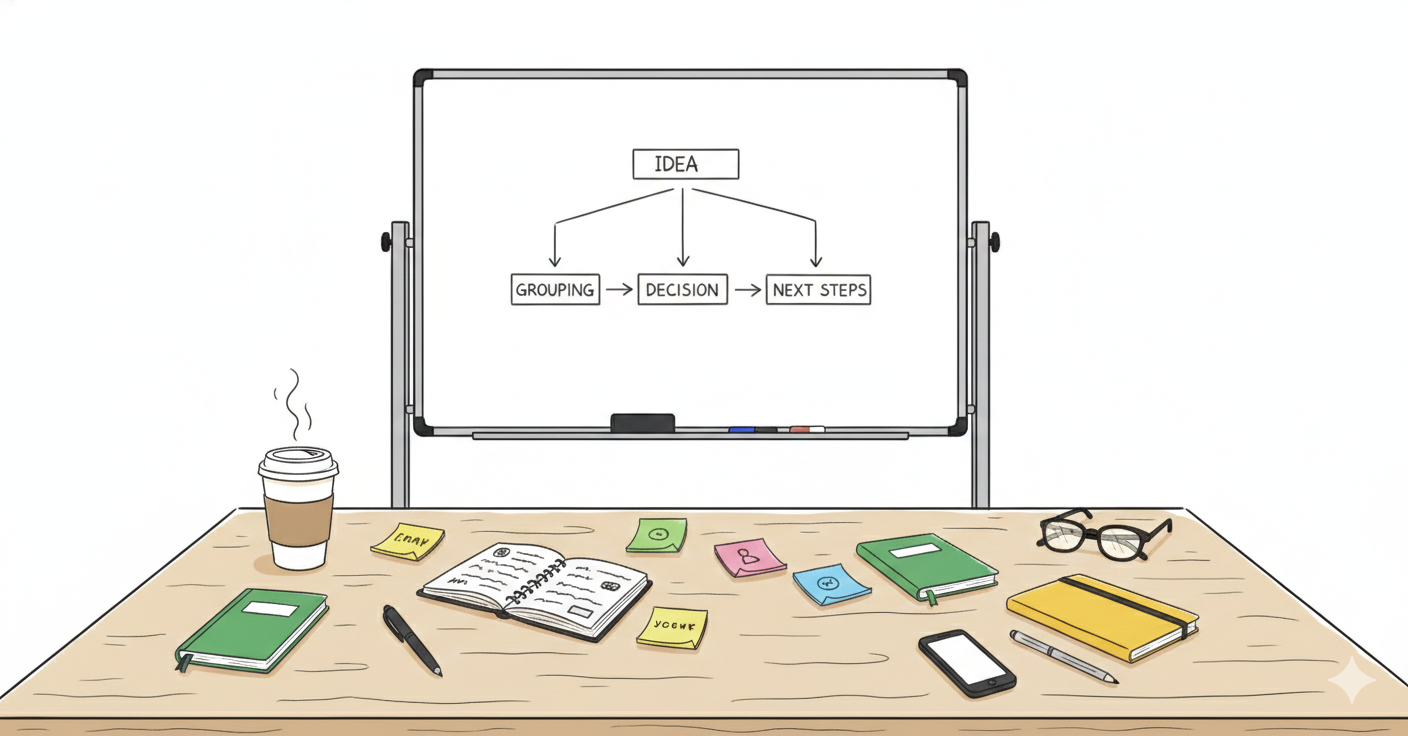
Map every step your customer takes and bring your whole team onto the same page.
Here be dragons – From assumption based to data backed maps
In times when the earth wasn’t orbited by hundreds of satellites and when one couldn’t simply air a drone, people had to work with what they had and explore the unknown step by step, mile by mile. The unknown has always been terrifying, but some brave adventurers always dared to go beyond the already-explored and fill in the blank spots on the maps.

Only the ones willing to take the highest risks (hoping for even higher rewards) dared to leave the comfort of their homes and thus the world they knew. Even the Romans denoted unknown areas with “Hic Svnt leones” (Here are lions). Especially in medieval times, unexplored territories have been illustrated by using dragons, monsters, and mythical creatures and the known term “Hic svnt Dracones” (Here are dragons) first appeared.

Not every civilization had the urge to expand their territories but every single one desired to explore the unknown. For some, this meant going beyond the known borders of the world. For others, exploration lay within gaining a deeper understanding of the details underlying what they already knew. Either way, they broadened their knowledge by questioning, and thus gathered more and more information.
The very same ideally applies to every organization. Journey mapping helps them to depict the known, discover knowledge gaps, and plan further research.
What is the current normal might be outdated soon, what seems to be true on a high-level perspective might not work on a detailed scope.
Parts of customer’s journeys – e.g. what customers are doing when not in direct interaction with a brand (steps vs. touchpoints) – often are a black box to organizations. More research with customers provides organizations with a clearer understanding of their customers actions and behaviours, and this understanding can be used to shape the future.

Democratization of mapping
The creation (and interpretation) of geographical maps was once based on specific technical and geographical bodies of knowledge that were available to a small group of experts only. Maps have been (and still are) a powerful tool, and as a result they mainly have been (and still are) of military, strategic, and economic importance for centuries. Whereas the common man wasn’t able to access – let alone read and interpret – maps for centuries, elites used maps to consolidate their power by not making this knowledge available to others.
For example, the Casa de Contratación, founded in 1503, was the Spanish crown’s agency to manage their expanding empire. They gathered precise information on their newly gained territories and created detailed maps that were crucial to their voyages and ongoing expansions. Mapmaking was one of their core missions and the maps created had been of highest importance and confidentiality in the run for new resources and riches.
The same can be observed in organizations that are either highly hierarchical or that have strong silos; information is not shared, or at worse, is intentionally hoarded.
The right organizational culture and structure not only helps to ease the gathering and sharing of information, but – when incorporating a customer-centric approach – helps to foster the application of useful data to subsequently improve the organization’s ability to compete in a more-and-more customer driven market.
Journey maps function as a guideline and signpost to navigate this troubled sea of constantly changing conditions. Which route to take, which sail to hoist, which cliffs to give a wide berth, and what to gain at the (not always known) destination, is not only something that needed to be done by sailors centuries ago, but also today by organizations.
Recruiting the best people and keeping the crew’s morale high (employee experience) is as important as knowing the right route to make an endeavour a successful one (customer experience). Sharing information across the organization can help set this culture, providing teams with the knowledge they need to steer their proverbial ship.
In the same way as satellite based remote sensing (digital data), the web 2.0 (e.g. open street maps), and the low-cost accessibility of GIS (geographic information software) democratised the creation, sharing, and availability of maps, journey mapping software provides the same to service-oriented organizations. The cracking of oligopolies in creating maps and the fusing of producers and consumers of maps revolutionized the field of geography. We see the same happening for service providers who hear the voices of their customers, proactively include them in the creation of new services, and use software to establish map and data repositories.
The beauty, necessity, and power of maps
Visualisation builds on humans’ capabilities to see patterns and helps to create a mental image of (often) complex information. It …
“… offers a method for seeing the unseen. It enriches the process of scientific discovery and fosters profound and unexpected insights.”
McCormick, BH. et al. (ed),
Visualization in Scientific Computing,
Computer Graphics 21, 6 (November 1987), p. 3
Therefore maps serve two purposes at once: they simplify insights, but also offer a path for deepening insights at the same time. They can provide an overview, yet still uncover details and patterns. They help to illustrate spatial, timely, and causal correlations. Sometimes maps do this by leaving out some of the base data if it’s not required for a specific purpose, and other times maps do this by zooming in and showing lots of details by emphasizing on specific aspects. This applies to geographical maps and journey maps in the very same way. In any form, it always includes interpretation and contextualization of raw data. A map’s purpose should always be clearly defined.
Good maps deliver information in a clear, precise and efficient way and are always closely tied to communication.
Both a quickly drawn map on a piece of jotting paper that allows a friend to find the closest supermarket, or a detailed topographical analysis of a defined region with all the details provided on different zoom levels, follow the parameters described above. The very same applies to journey maps. Whether a roughly sketched high level map or a zoomed-in map showing every step undertaken, the very same story applies.
On top of the mere power to deliver and contextualize information and tailor it to an audience, maps also depend on a certain level of beauty. Beauty is what grabs our attention, sharpens our focus, and motivates us to come back. A lot of maps also tell a story. The story of the undiscovered, a story that we’ve already experienced, or the story of something we are currently a part of. Those who have been engrossed by the Lord of the Rings (the books) will know what I am talking about.

Maps help us to understand the world and business alike. In a complex environment and under constantly changing circumstances, maps give orientation, help us to find your way back, open perspectives, and assist in understanding the world around us. What’s true for understanding the world we’re living in, is also true for the business we’re doing.
Purpose and beauty make good maps. Good maps reveal a story, and stories help us understand the world. Understanding the world helps us change it for the better. And that’s exactly what make maps so powerful.
FEELING INSPIRED?
SHARE THIS ARTICLE WITH YOUR NETWORK!
Build journey maps grounded in customer evidence and keep them current as what you learn changes.


