Every journey map makes claims about what customers experience. Research-based journey mapping is the practice of grounding those claims in evidence: interviews, observation, analytics, and behavioral data rather than team assumptions.
The difference matters. An assumption-based map reflects what your team thinks happens. A research-based map reflects what customers actually told you, what the data shows, and what you observed firsthand. The second version is harder to dismiss, easier to act on, and far more likely to drive real decisions.
This guide focuses on the creation process: how to collect the right research, synthesize it, and translate findings into map elements. It sits within the broader discipline of customer journey mapping and complements the step-by-step process for creating a customer journey map by going deeper on the research inputs.
Why assumptions alone produce weaker maps
Assumption-based maps aren't useless. They're fast to create, good for aligning teams around a shared starting point, and useful for surfacing where internal knowledge gaps exist.
But they have a credibility problem. When a stakeholder asks "how do you know this is what customers experience?" and the answer is "we discussed it in a workshop," the map becomes a conversation starter at best. When the answer is "we interviewed 8 customers and analyzed 6 months of support data," it becomes a decision tool.
Assumption-based maps also tend to reflect internal process rather than actual customer experience. Teams map what they think happens based on how they've designed the service. Customers don't follow the designed path. They skip steps, use channels you didn't expect, and struggle with things you assumed were obvious.
The practical approach: start with assumptions when you need to move quickly. But treat the result as a hypothesis, not a conclusion. Then layer in research to validate, challenge, and fill gaps. Once the initial map exists, research-driven journey mapping as an ongoing practice keeps the map grounded as the experience evolves.
Start with what you already have
Before planning new research, audit what your organization already has. Most teams sit on useful data they've never mined for journey mapping purposes.
Existing data worth reviewing:
- Support tickets and complaint logs (pain points, common issues)
- NPS, CSAT, or CES survey data (satisfaction by touchpoint)
- Website and product analytics (traffic flows, drop-off points, feature usage)
- Sales call notes and CRM records (objections, questions, decision factors)
- Social media feedback and online reviews (unsolicited customer language)
- Previous research reports (user testing, market research, UX studies)
Organize what you find by journey stage, even roughly. This accomplishes two things: it gives you a partial evidence base to start from, and it reveals exactly where your knowledge gaps are. Those gaps tell you where to focus your new research.
Qualitative research methods for journey mapping
Qualitative research answers the "why" behind customer behavior. It reveals the stories, emotions, motivations, and frustrations that make a journey map human rather than mechanical.
Customer interviews
Interviews are the single most valuable method for journey mapping. A 45-minute conversation with someone who recently went through the journey you're mapping yields richer insight than weeks of analytics.
The key is asking for stories, not opinions. "Walk me through the last time you..." produces a narrative with stages, emotions, touchpoints, and pain points naturally embedded. "What do you think of our onboarding?" produces generic feedback that's hard to place on a map.
Five to eight interviews is typically enough to surface patterns. You're not looking for statistical significance. You're looking for recurring themes, shared frustrations, and consistent descriptions of how the experience unfolds. When interviewees start telling you things you've already heard, you've reached saturation.
What interviews feed into your map: emotional arcs, motivations and goals at each stage, pain points in the customer's own words, decision factors, and touchpoints you didn't know existed.
Observation and contextual inquiry
Watching customers interact with your service in real context reveals things interviews miss. People don't always report their own behavior accurately. They forget steps, understate frustration, and rationalize decisions after the fact.
Observation can be in-person (field studies, shadowing, in-store observation) or remote (session recordings, user testing tools, screen-share walkthroughs). Either approach surfaces the gap between designed experience and actual experience.
What observation feeds into your map: actual touchpoint sequences (not recalled ones), friction points customers work around rather than report, time spent at each step, and behaviors that contradict stated preferences.
Diary studies
Diary studies ask participants to document their experience over time: recording interactions, emotions, and decisions as they happen rather than recalling them after the fact.
This method works best for journeys that span days or weeks, like onboarding, consideration cycles for expensive purchases, or ongoing service relationships. It captures the full temporal arc that a single interview or observation session can't cover.
What diary studies feed into your map: the emotional journey across the full timeline, moments of hesitation or re-evaluation, touchpoints between major milestones, and the real pace at which customers move through stages.
The trade-off: diary studies require participant commitment over a longer period, and drop-off rates can be high. Plan for more participants than you need.
Quantitative data to layer into your map
Quantitative data answers different questions than qualitative. Where interviews tell you why a customer is frustrated, analytics tell you how many customers experience that frustration and where they drop off.
Key quantitative sources for journey maps:
- Web and product analytics: Traffic flows, conversion paths, bounce rates, feature adoption curves. These show the actual paths customers take, not the paths you designed
- Survey data at scale: CSAT or NPS scores broken down by touchpoint or stage. Reveals which parts of the journey perform well and which don't
- Operational metrics: Average response times, resolution rates, wait times, processing durations. These map directly to the backstage and help explain customer-facing friction
Quantitative data is especially useful for map elements like channel usage, volume and frequency at each touchpoint, and satisfaction indicators across stages. It adds weight and specificity to the qualitative themes. Teams that integrate journey metrics directly into their maps get the added benefit of keeping the quantitative layer current as data refreshes.
Smaply links interview quotes, analytics, and survey data straight to the map elements they support.
Planning your research
You don't need a multi-month research program. A practical minimum for research-based journey mapping: 5-8 customer interviews, one quantitative data source you already have, and a review of existing internal data.
How much research you need depends on your context:
| Context | Recommended approach | Timeline |
|---|---|---|
| New product or service | Full qualitative + quantitative: interviews, observation, analytics | 4-8 weeks |
| Existing journey, first map | Interviews + existing data audit + analytics review | 2-4 weeks |
| Known problem area | Focused interviews on the specific stage + targeted analytics | 1-2 weeks |
| Workshop follow-up | Validate assumption map with 5-6 interviews + existing data | 2-3 weeks |
Data triangulation matters. Use at least three sources to validate findings. When interview themes, analytics patterns, and support ticket trends all point to the same pain point, you can be confident it's real.
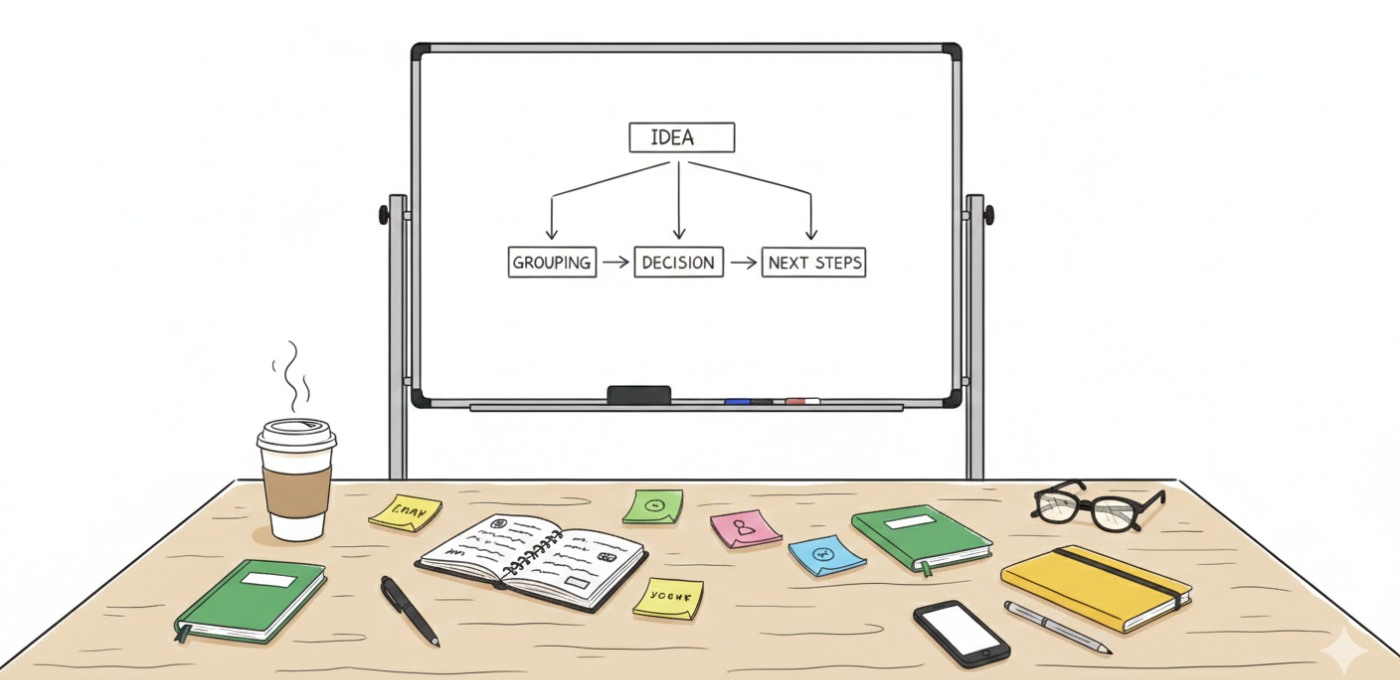
From research to map: synthesizing your findings
This is where most teams struggle. They collect good research but don't know how to turn it into map structure. The synthesis step is what separates a research-backed map from a data dump with sticky notes.
Clustering data around journey stages
Start by grouping your research findings by the stages of the customer experience. If you're building from scratch, let the data reveal the stages rather than imposing a template. Look for natural breakpoints in customers' stories: the moments where their mindset shifts, their goals change, or they transition to a new phase of the relationship.
If you already have stages from an assumption-based map, use them as a starting framework. But be willing to adjust. Research often reveals stages that teams didn't anticipate, or collapses stages that felt separate internally but are a single experience for customers.
Translating findings into map elements
Each type of research data feeds into specific map elements. Making this mapping explicit keeps your journey map traceable.
| Research input | Map element it feeds |
|---|---|
| Interview quotes about feelings | Emotional journey lane |
| Observed customer interactions | Touchpoint cards |
| Analytics drop-off data | Pain point markers |
| Survey satisfaction scores | Satisfaction curve by stage |
| Support ticket themes | Pain points and opportunities |
| Diary study entries | Timeline steps and emotional arc |
Index each element back to its source evidence. When a pain point on the map says "customers can't find their order status," the underlying data should be traceable: which interviews mentioned it, what the analytics show about that page, how many support tickets reference it. This traceability is what gives the map credibility and what distinguishes each journey map element from a guess.
Building the map iteratively
Don't try to build the finished map in one pass.
First pass: create the rough structure from your research clusters. Stages, key steps, major touchpoints. This is the skeleton. Second pass: add the detail lanes. Emotions, channels, pain points, backstage actions. Third pass: validate with research participants, frontline staff, or stakeholders who know the journey well. Ask them what's missing, what's wrong, and what surprises them.
The map is a synthesis artifact, not a data dump. Not every data point belongs on the map. Include what's most relevant to your objective and what best represents the patterns across your research.
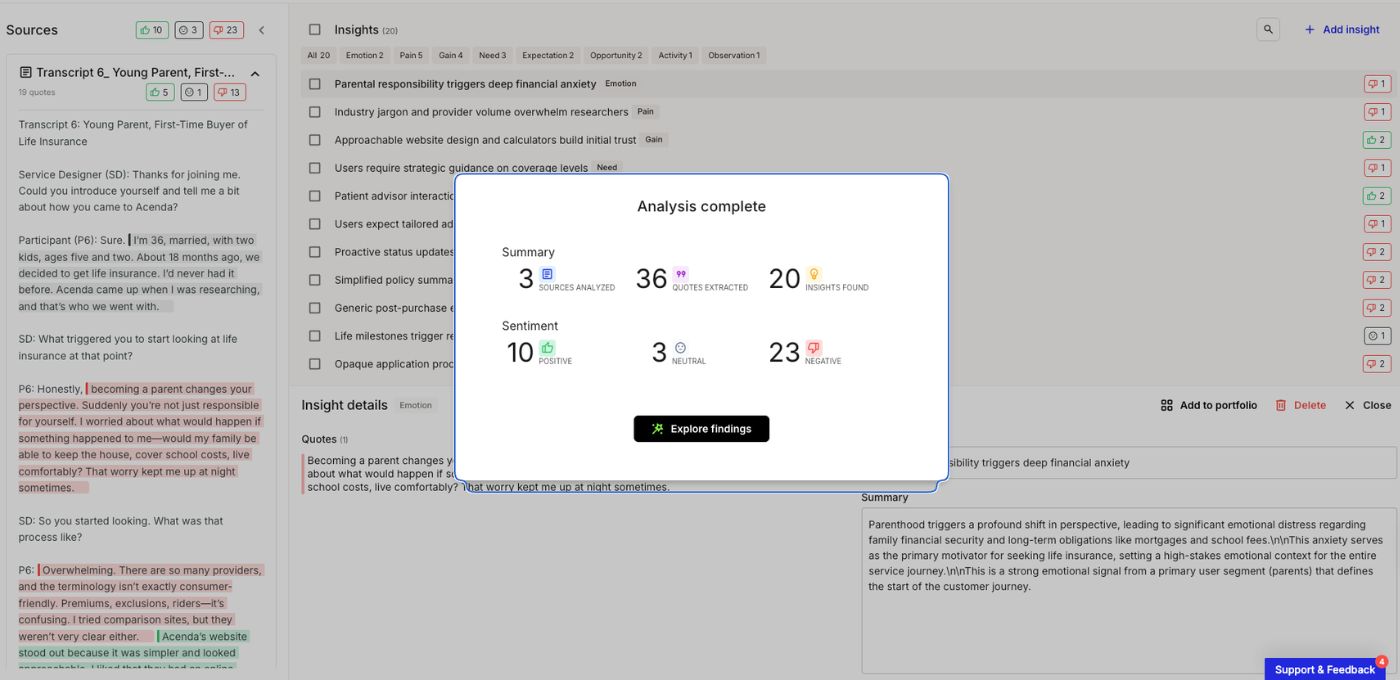
Smaply's Research Hub is designed for this workflow. It lets teams ingest interview transcripts and research notes, extract key themes and quotes, and connect those findings directly to journey maps, keeping the link between evidence and map elements intact as the map evolves.
Common mistakes in research-based mapping
Running research without a clear mapping goal. Collecting data for its own sake produces a pile of insights with no structure. Define what journey you're mapping and what questions you need answered before starting research.
Over-relying on a single method. Interviews alone miss behavioral patterns. Analytics alone miss the "why." Use at least three sources to triangulate findings and build a more complete picture.
Imposing internal stages instead of letting customer experience define structure. If your stages map to departments or internal processes, the research didn't drive the structure. Let customer stories reveal where the natural breakpoints are.
Losing the connection between evidence and map elements. A research-based map without traceability is just an assumption-based map with a better origin story. Maintain the link between what's on the map and the data that supports it.
Treating the first version as final. Research-based maps are more grounded than assumption-based ones, but they're still incomplete. New research, changing markets, and product updates mean the map needs regular revisiting. A map built on six-month-old data is already drifting from reality.
A research-based map is a starting point with stronger foundations, not an endpoint. What makes it valuable long-term is that every element traces back to evidence, making it credible enough to drive decisions and clear enough to know where it needs updating.
Frequently asked questions
How many interviews do you need to build a research-based journey map?
Five to eight customer interviews is typically enough to identify recurring patterns and ground your map in reality. You're looking for shared themes, not statistical significance. Supplement interviews with at least one quantitative data source for a more complete picture.
What's the difference between assumption-based and research-based journey maps?
Assumption-based maps are built from internal team knowledge and hypotheses. Research-based maps ground every element in actual customer evidence from interviews, observation, analytics, or surveys. Assumption maps are useful starting points, but research-based maps carry more credibility and lead to better decisions.
Can you start with an assumption-based map and add research later?
Yes, and this is often the most practical approach. Build an assumption map to align your team and identify knowledge gaps, then use targeted research to validate, challenge, or fill those gaps. Treat the initial map as a hypothesis, not a conclusion.
How long does it take to create a research-based journey map?
Timelines vary by scope. A focused effort typically takes 2-6 weeks: time for an existing data audit, primary research like interviews, and synthesis into map structure. Smaller scopes with existing data available can move faster. The key is scoping research to match your objective rather than trying to cover everything.
Which research method is most important for journey mapping?
Customer interviews provide the richest data because they reveal emotions, motivations, and the full narrative of a customer's experience. If you can only do one method, start with interviews and supplement with whatever quantitative data you already have.